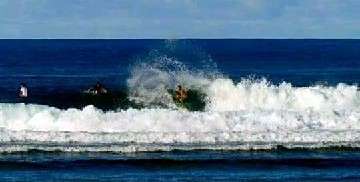
Read a surf forecast through four numbers: height, period, swell direction and wind. Tide comes after them, and in Siargao it matters a great deal, because every wave around General Luna breaks over reef. The order matters too: first check whether the swell reaches the spot from its direction at all, then how much energy the wave carries, and only last look at the big, bold number, the height.
This guide takes apart one line of our forecast, explains where the numbers come from and how far you can lean on them. We also say where our forecast is blind, because there are a few such places. To follow real data as you read, open the surf forecast for the 12 spots in another tab.
What one line looks like, and what it says
The values in the table below are an example we built to explain the reading. They are not a real day. The line imitates Cloud 9, a spot that faces north-east.
| Field | Example value | What you read from it |
|---|---|---|
| Surf height | 1.0 to 1.3 metres | The model’s calculated height range at the break, so an estimate only |
| Primary swell | 0.7 metres, 11 seconds, from 30 degrees | The direction is inside the spot’s swell window, and the period is over 10 seconds, which adds a point to the rating |
| Wind | 12 km/h from 220 degrees | Wind blowing from land to sea, so offshore for this spot |
| Rating | 4 out of 5, fair to good | Two points for height in the spot’s usual range, one for a period of 10 seconds or more and one for offshore wind |
Notice that the swell is only 0.7 metres, yet the height at the break comes out at 1.0 to 1.3 metres, because the period is long and the swell arrives close to the direction the spot faces. What makes the day is the combination of a direction inside the window, a long period and offshore wind. What the line does not tell you, how much water is over the reef, shows up in a different number, the tide.
Wave height Hs: what the number actually measures
The official term is significant wave height, or Hs for short. According to NOAA NDBC it is approximately equal to the average of the highest third of the waves, measured from trough to crest. NDBC calculates it from the sea’s spectrum: four times the square root of m0, the variance of the water surface height. In other words it is a statistic that describes the state of the sea at one point over a given period of time.
It follows from the definition that some waves will be taller than Hs. A note from the US National Weather Service for users of wave forecasts puts numbers on it, based on wave theory: one wave in ten reaches 1.25 times Hs, and one in a hundred reaches 1.67 times. These ratios assume the usual spread of wave heights in open water. A wave that rises and breaks on a reef behaves differently, so treat them as an order of magnitude.
There is another difference. Hs is the size of the sea in an area, while the surf height in our forecast is a separate calculation, explained further down. When you compare the number in the forecast with the height you see from the beach, you are comparing two different things.
Swell versus wind waves, and why period matters
According to the Australian Bureau of Meteorology, wind waves (sea) are made by wind that is blowing now, or blew recently, in the area where you are looking, and their period is short. Swell is made somewhere else, and its waves may travel thousands of kilometres before they reach you. That is why the sea can be full of waves even on a day with no local wind.
The model we use splits the sea into three parts: primary swell, secondary swell and wind waves, each with its own height, period and direction. In a forecast it is worth looking at the primary swell first. It is usually the one that builds the set.
According to the Australian bureau, the period is the time between successive crests of the most energetic waves. NDBC defines the dominant period more technically: the period at which the sea’s spectrum is strongest. The bureau adds that when a long-period swell approaches shallow water, it slows down while growing and becoming steeper.
Now the numbers. By a standard textbook formula for deep water, found in the Wikipedia entry on wave power, the power of a wave per metre of wave front is directly proportional to the square of the height and to the energy period. Doubling the height at the same period multiplies the power by four, and raising the period from eight seconds to twelve adds half again at the same height. The formula holds in deep water and uses the energy period, which is not exactly the period shown in a forecast. So period does not decide things alone. It is one factor in the formula, next to the square of the height.
Swell direction and each spot’s swell window
Swell direction is measured in degrees and tells you where the wave comes from, clockwise from north. Every spot has a window: the range of directions it can receive, because the way the spot faces and the land around it block the rest. We defined the windows in our spot data, and they are our own estimate, not a measurement from an outside source.
The simplest example is two spots that face opposite ways. Cloud 9 faces north-east, and its window opens from 340 degrees through north and east to 150. A south-west swell does not reach it, and in our calculation its height drops to zero. Guiwan faces south, and its window opens from 90 to 200 degrees, so swell from the east to a little past south. On a day when Cloud 9 gets a northerly swell, Guiwan can be flat, and the other way round.
These windows explain much of what is written in the guide to the best time to learn to surf in Siargao. A spot facing north-east needs swell from the north or east, and a spot facing south needs swell from the east or south, so no single spot works every day. For which spot suits which level, see the surf spots page.
One more detail from our code: for each swell we widen the window by a few degrees, and more when the period is long, to allow for the wave bending as it nears the coast. That is our assumption, and we have not calibrated it against measurements.
Wind: offshore, onshore and the monsoon picture
Offshore wind blows from land to sea, into the face of the wave. A Scripps study published in the Journal of Fluid Mechanics and reported in February 2023 found that such wind tends to encourage hollow, tubular waves, the kind advanced surfers like, while onshore wind tends to make spilling waves with whitewater. In the same article Falk Feddersen of Scripps says that wave models to date have not included these wind effects. Our forecast does not include them either: it gives rating points by wind direction and does not predict wave shape.
Our classification is simple. Below 8 km/h the wind counts as light. Wind from within 45 degrees of the direction the spot faces, in other words from the sea, is onshore. Wind from 135 degrees or more away from that direction, in other words from the land side, is offshore, and everything in between counts as cross-shore.
The monsoons change the picture through the year. In winter a north-east wind called amihan blows across the area, and in another part of the year a south-west wind called habagat. By our classification, a north-east wind is onshore for Cloud 9, which faces north-east. For Guiwan, which faces south, it comes from the land side, but at an angle our classification still calls cross-shore rather than offshore. That fits the seasons in our spot data: Guiwan is a winter spot, when the wind is from the north-east, and Cloud 9, for which a south-west wind is offshore by the same classification, peaks from late September to November. This is a general picture. The change between seasons does not happen in a day, and the actual wind also shifts within the day.
Tide on a reef: how much water is over the rock
On a sandy beach the tide moves the place where waves break. On a reef it changes the wave itself. It can break hard and hollow in shallow water, and soft and wide when there is more water. In our spot data Tuason is a fast left over a very shallow reef, where high tide is preferred. Jacking Horse has a side current at high tide and around the full moon.
We calculated the tide for General Luna with EOT20, a global tide model based on satellite measurements. According to the 2021 paper by Hart-Davis and others, it has 17 tidal constituents on a 0.125 degree grid, and its biggest improvement over an earlier model was in coastal regions. In our calculation from the model, over 457 days starting on 1 October 2026, the daily difference between high and low tide ranges from 0.65 to 2.21 metres, and averages 1.45 metres.
These numbers are model calculations. We did not compare them with a local tide gauge, because we could not find an official tide table for General Luna. Even so, the conclusion is clear: a day when the difference is close to 0.65 metres and a day when it is close to 2.21 metres are two different days on the same reef. Our forecast shows the tide, but it does not enter the rating. You check that yourself, or ask the coach.
Where the numbers come from, and how far you can lean on them
The waves on our site come from two models. The main one is MFWAM from the European Copernicus Marine service: a third-generation model with 1/12 degree resolution and a 10-day forecast in three-hour steps, updated at 00:00 and 12:00 UTC and driven by ECMWF winds. The second is WAVEWATCH III, NOAA’s operational wave model. We use it as a backup and as a cross-check: when the mean wave height of the two sources differs by more than 50 percent, the agreement between them is marked as low.
Our wind comes from ECMWF open data at 0.25 degree resolution, and the tide from EOT20. When you look at one line of the forecast, you are really looking at several sources stitched together.
How accurate is it? A NOAA study (Campos and others) re-ran wave forecasts for past years and checked their accuracy by forecast day. The correlation for Hs was 0.95 to 0.96 on day one, 0.86 to 0.88 within the first week and below 0.70 after day 10, and most of the loss in accuracy came between day four and day ten. That is an ensemble forecast from a different system, so for our forecast the numbers are only an indication. What we take from it: read the first three days seriously, and read the fourth and fifth as a trend.
How our forecast calculates height and rating, and what it cannot see
The forecast covers 12 spots for 5 days, in 40 three-hour steps, in Manila time, and it updates six times a day. Each spot has a point in the model, in the open sea, and the swell and wind are taken from it.
For each part of the sea we check whether its direction is inside the spot’s window. If it is, we calculate a breaking height with a formula based on Komar and Gaughan (1972), which takes the deep-water height and period. We reduce the result the further the swell direction is from the direction the spot faces. The parts are combined as the square root of the sum of squares, and the forecast shows a range: from 0.85 to 1.15 times the resulting height, rounded to a tenth of a metre. That is how the 0.7 metre swell in the table above became a range of 1.0 to 1.3 metres.
The rating from 0 to 5 is built from a few rules. Flat, under 0.3 metres, is always 0. Two points if the height is in the spot’s usual range, one point if the primary period is 10 seconds or more, and one point for offshore or light wind. One point is deducted for cross-shore wind above 15 km/h, and two for onshore above 15 km/h.
What the forecast does not know
Our model point sits in the sea, and one cell of the 1/12 degree grid is about 9 kilometres wide. The reef itself, local bending of the wave and the shape of the seabed are not calculated. The size ranges for each spot are defaults and have not been calibrated. The wind comes from a coarse grid, so local sea breezes are smoothed out. The rating knows nothing about your level or how crowded the water is, and it leaves the tide out. The model is meant for planning and is not an official forecast.
Typhoons and warnings
Official warnings come from PAGASA, the Philippine weather service, which publishes the Tropical Cyclone Bulletin, the Gale Warning and the Weather Advisory. Our page is not a warning service. One more thing, as the Australian bureau wrote: swell may travel thousands of kilometres. So a distant storm can raise waves on a coast where the sky is perfectly clear. If PAGASA has an update, it comes before any number of ours.
Our opinion, and it costs us money
Do not choose a lesson day or a spot by a single number in the forecast, or by the rating alone. On our forecast, a high rating mostly means the height is in the spot’s usual range, the period is long and the wind is clean. At advanced spots that is often a day when the wave breaks hollow and powerful over the reef, which is less pleasant for beginners. For them, the best learning day is usually a day when the forecast says small.
Here is another one that costs us lessons: in our view, experienced surfers who see a small sea in the forecast, under 0.6 metres, are better off waiting for swell than booking a lesson that day. A lesson for advanced surfers works on timing, wave selection and position in the lineup, and for that you need waves. Beginners who are drawn to a high rating should remember that our rating is blind to level and to tide. The coach stands on the beach in the morning and sees the water itself, and his judgement comes before any model. You can meet our coaches, compare two neighbouring spots on the forecast pages, Cloud 9 for advanced surfers and Jacking Horse for beginners, and read about learning spots in the guide to beginner spots.
About the authors
Francis, Michael and Glenn, the local surf coaches of Surfing Sirago in General Luna. Michael (26) was born and raised in Siargao and is a certified instructor with the Siargao Island Surfers Association (SISA). Glenn (38) has surfed since he was 17 and holds a SISA level 2 licence. WhatsApp Michael: +63 950 304 3184.
Frequently asked questions
What is period in a surf forecast?
Period is the time in seconds between successive crests of the most energetic waves. By a standard textbook formula for deep water, a wave with a longer period carries more power than a wave of the same height with a shorter period.
Which wind is best for surfing?
For experienced surfers, usually offshore wind, blowing from land to sea. According to a 2023 Scripps study it tends to make a hollow wave, while onshore wind tends to make a spilling wave with whitewater. The offshore direction differs from spot to spot, because it depends on which way the spot faces.
How far can you trust a five-day forecast?
According to NOAA research, accuracy drops over the days, and most of the drop happens between day four and day ten. So, in our view, in a five-day forecast you should take the first three days seriously and read the fourth and fifth as a trend.
Why does tide matter on a reef?
Because the amount of water over the reef changes the shape of the wave and the danger. In our calculation from EOT20, the daily tide difference in General Luna ranges from 0.65 to 2.21 metres.
Where do you check typhoon warnings?
From PAGASA, the Philippine weather service, which publishes updates and warnings. Our site shows model data for planning surf sessions and is not a warning service.
Why is the forecast different from the wave you see on the beach?
The model calculates a point in the sea, in a grid cell about nine kilometres wide, and it cannot see the reef itself. Surf height is an estimate derived from Hs, and Hs itself is roughly the average of the highest third of the waves, so individual waves will be taller than it.
- NOAA NDBC, explanation of wave height Hs and period calculation
- US National Weather Service (NWS), note to users of wave forecasts
- Australian Bureau of Meteorology (BoM), ocean waves explainer
- Wikipedia, wave power (deep-water formula)
- Scripps Institution of Oceanography, wind and breaking wave shape
- Copernicus Marine, MFWAM wave product
- ECMWF, open data
- NOAA, wave reforecast (Campos et al.)
- EOT20, tide model (Hart-Davis et al., 2021)
- PAGASA, Philippine weather service